KLAS Contact

Contact KLAS
Contact KLAS
 2024 BEST IN KLAS
Preferences
Related Series

Cerner Global 2013
A Detailed Look Outside the United States

Author
Jonathan Christensen
Providers around the globe are looking to vendors like Cerner that can provide a core EMR with a range of departmental solutions. This report on Cerner is the first in a series of studies highlighting providers’ experiences with EHR vendors outside the United States. With the intricacies that multinational companies face, how well does Cerner meet the needs of clients in different parts of the world? Are they a viable partner? Are they worth the effort and cost? To find answers to these questions, KLAS spoke with 35 provider organizations outside the United States.
Worth Knowing
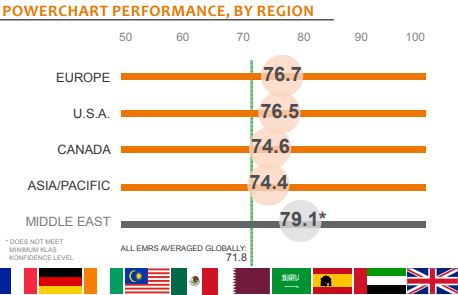
Consistently High Performing Across the Globe
Providers in all regions consistently rated PowerChart ahead of the global EMR market average by about three to seven points. Providers were successfully using Cerner in English, French, German, and Spanish, and Cerner offers some patient-facing content in Arabic. Additionally, customer support and vendor relationships were the top-listed ways that Cerner was exceeding expectations in every region, helping them overcome unique regional challenges. However, UK customers indicated that Cerner has yet to fully adapt their products and approach to meet NHS requirements.
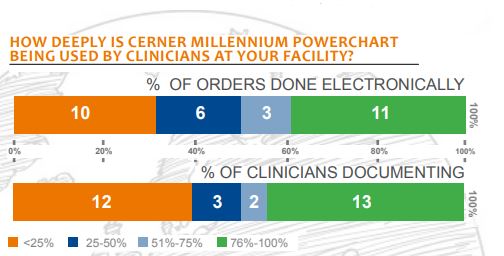
Though Variable, PowerChart Deeply Adopted in Many Areas
Nearly 50% of Cerner customers were doing at least half of their orders and documentation electronically. Cerner also has a large number of HIMSS Level 6 hospitals and a Level 7 hospital outside the United States. Respondents in the Middle East and Malaysia had very deep adoption of Cerner’s technology; Canada had very shallow CPOE adoption as many respondents had yet to deploy it fully. Europe had low adoption of electronic documentation, mostly as a result of the complexities of the National Programme in the UK. Respondents in Spain, France, and Germany were using PowerChart deeply
Customers Staying the Course
All respondents outside the United States reported that Cerner is part of their long-term plans (compared to 95% within the United States), and 91% said they would buy Cerner again. Looking to the future, most customers said they plan to add more Cerner products (e.g., SurgiNet, PharmNet, and Anesthesia) or additional functionality (e.g., electronic ordering and clinician documentation). A few customers are reevaluating market offerings because their governmental IT initiatives have changed, but most said it was Cerner’s contract to lose.
Expensive, but Customers Planning to Expand
Two of the most frequently mentioned areas where Cerner was falling short of expectations were cost and contracting. Providers gave Cerner low marks for money’s worth because the system is relatively expensive compared to other solutions. Customers reported high costs for modules, licensing, implementations, and ongoing services. However, customers do feel they get value; over two-thirds are planning to buy more products, and 91% would buy again.
Bottom Line on Regions
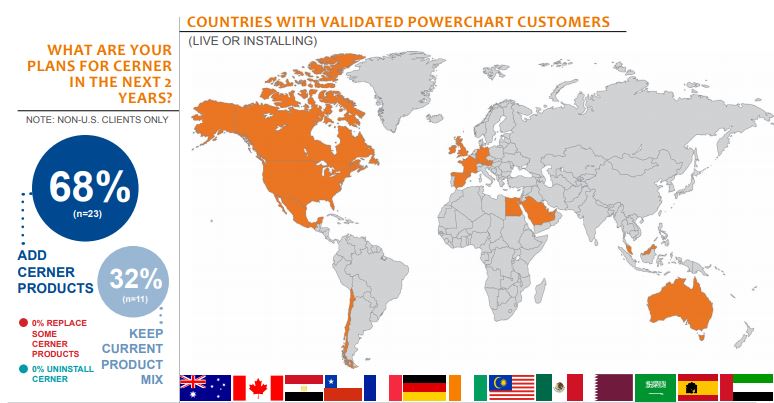
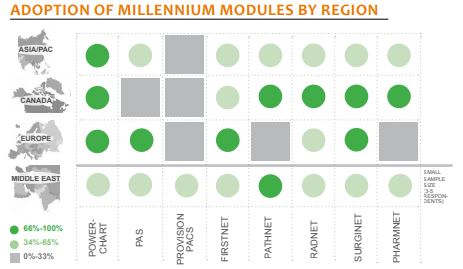
Asia/Pacific— Customers in Australia and Malaysia. Deep adoption of CPOE and documentation in Malaysia; little documentation being done electronically in Australia—ease of use a struggle for many. Some serious implementation struggles in Australia. Good vendor-provider relationships. Low adoption among Australian respondents of departmental solutions. No respondents in region using PACS.
Canada— Low adoption of CPOE; many working on rolling out this functionality. Good adoption of departmental solution, though PAS deployment shallow among PowerChart customers; customers have opted for more regional-specific offerings. No respondents using PACS.
Europe— Validated customers in Austria, France, Germany, Ireland, Spain, and the United Kingdom. UK clients reported Cerner has not fully anglicized the PAS or adapted to regional pricing structures. Third-party service model in UK leaves clients less satisfied with both PowerChart and PAS, but customer relationships show improvement, and many plan to directly contract with Cerner going forward. Little adoption of PACS, PharmNet, and PathNet in UK. High satisfaction and deep adoption of electronic ordering among customers using French, German, and Spanish versions of PowerChart. Respondents in mainland Europe more satisfied with PowerChart than those in the UK, though none were using PathNet.
latin america/caribbean— Limited customer base in this region. Validated customers live or installing in Chile, Mexico, and the Cayman Islands. All modules validated as in use except PACS
Middle East— Validated customers live or installing in Egypt, Qatar, Saudi Arabia, and the UAE. Highest rating region for PowerChart, though from a smaller sample size than in other regions. Deep adoption of electronic ordering/documentation across large, multihospital organizations. Several customers using near full suite of Cerner products, but a couple using only PathNet. Mostly used in English with some Arabic content for patient-facing pages. Several implementation customers report that regional implementation resources are stretched thin.
United States— Not a focus for this report. However, very good success with hosting model. Clients have recently reported an improved relationship and product quality. Consistently the secondmost adopted EMR.
Writer
Jonathan Christensen
This material is copyrighted. Any organization gaining unauthorized access to this report will be liable to compensate KLAS for the full retail price. Please see the KLAS DATA USE POLICY for information regarding use of this report. © 2024 KLAS Research, LLC. All Rights Reserved. NOTE: Performance scores may change significantly when including newly interviewed provider organizations, especially when added to a smaller sample size like in emerging markets with a small number of live clients. The findings presented are not meant to be conclusive data for an entire client base.